
/ Monitoramento em tempo real

Veja o que a rede está fazendo agora

O painel SmartVoolt exibe tensão, correções e eventos elétricos em tempo real. Nada invisível, nada sem registro.
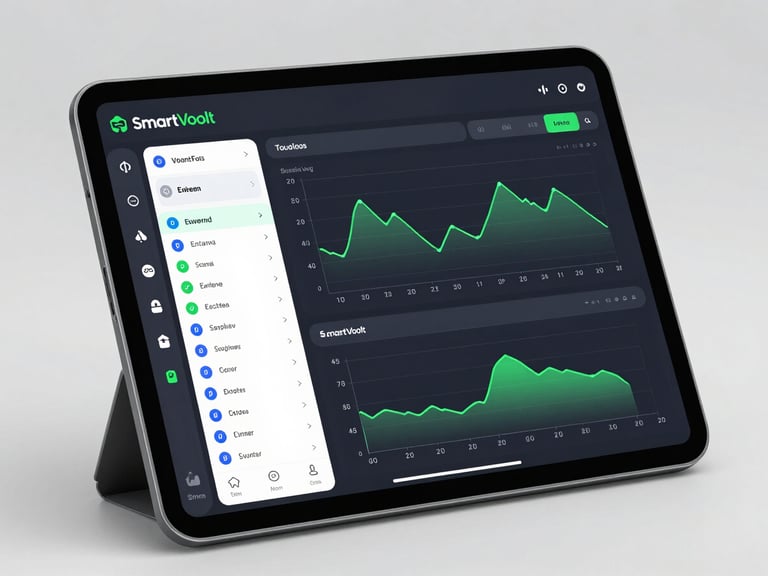
Full-screen interface mockup of the SmartVoolt app dashboard on a tablet, showing real-time voltage graphs with green data lines, event log entries, and stabilization status indicators on a dark UI background, bright studio lighting, tight framing
— Dados ativos, sem suposições

Cada flutuação registrada e visível

Gráficos de tensão, histórico de eventos e status de correção automática—tudo em um painel centralizado. Downtime invisível não existe mais.
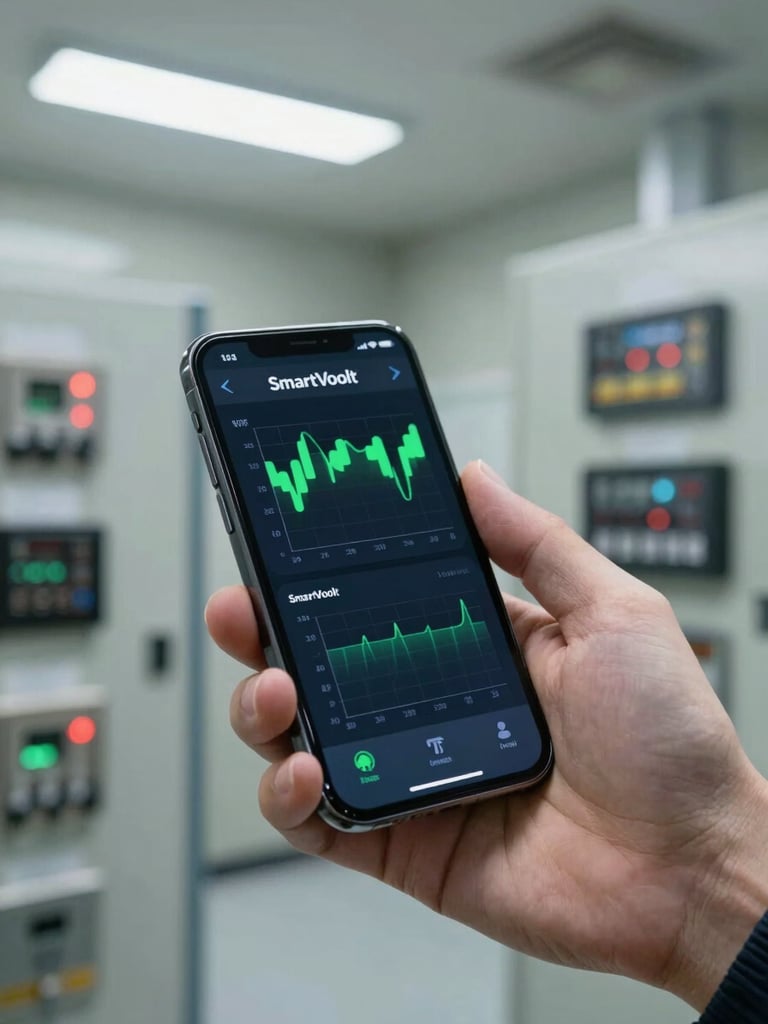
Close-up of a smartphone screen showing SmartVoolt app voltage monitoring graphs with green stabilization lines, held in a hand inside an industrial electrical panel room, bright overhead fluorescent lighting, clinical and sharp
• Acesso de qualquer lugar

Sem precisar estar no local

Via app.smartvoolt.com.br, gerentes e operadores consultam tensão, alertas e histórico de qualquer dispositivo conectado. Nenhuma zona cega na instalação.
Proteção mensurável, dados sempre acessíveis

Acesse o painel SmartVoolt agora. Seus dados de estabilização estão disponíveis, em tempo real.